What’s the easiest way to calculate your weekly metrics when your data has a daily granularity? Simply create a new calculated column for the “week start date” or “week end date” to use in your visuals! This is very easy to do, but maybe a little counterintuitive to the new Power BI user. Let’s dive into a quick example on how to set this up.
I have imported an Excel file that contains two columns, Date and Revenue. You can see in the table visual below that I have my sales date on a daily granularity.

Let’s say that I don’t necessarily care how much revenue I made on 1/7/2013, but rather how much revenue I made the week starting on 1/7/2013 (which was a Monday) and ending on 1/13/2013 (Sunday). This is easy to do with a little DAX.
I am simply going to create a calculated column on my data table and use the following DAX formula:
Week Start Date = Data[Date] – WEEKDAY(Data[Date],2) + 1
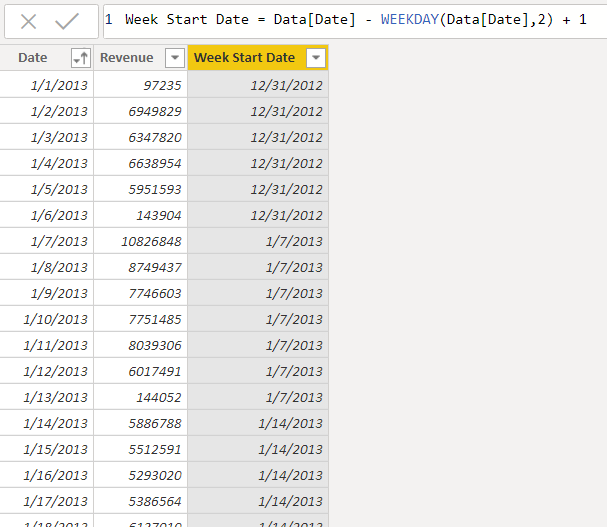
You can see that certain dates are grouped to ranges of 7 days. For example, 1/1/2013 was a Tuesday so its “Week Start Date” is Monday, December 31st 2012. Another example is 1/9/2019 which was a Wednesday. This means that its week start date was 1/7/2019.
The formula is simple but confusing until you break it down. I’m going to remove part of the formula and show each step with pictures. In this next image, I am only showing what the WEEKDAY function does:

Simply put, it returns the day number of the date depending on the parameter you chose. In the above example, I chose a parameter of 2 which sets Monday as 1, Tuesday as 2, Wednesday as 3, etc.
In this next picture, I am going to add back the first part of the final formula.

We are taking our original date and subtracting the WEEKDAY number from the previous step. The first row, for example, would be 1/1/2013 – 2 days = 12/30/2013. At this point, we can check which day that 12/30/2013 was and it was actually a Sunday, so all we need to do is add 1 day back to the calculation to give us Monday. This brings us to the original formula, shown again below:
Take a couple minutes to let the logic sink in. It can be very confusing but it clicks after a while. Similarly, we can calculate the “Week End Date” with a small change in the logic. Simply add 7 to the output instead of 1.
Week End Date = Data[Date] – WEEKDAY(Data[Date],2) + 7

Finally, we can easily use these calculated columns in any of our visualizations.
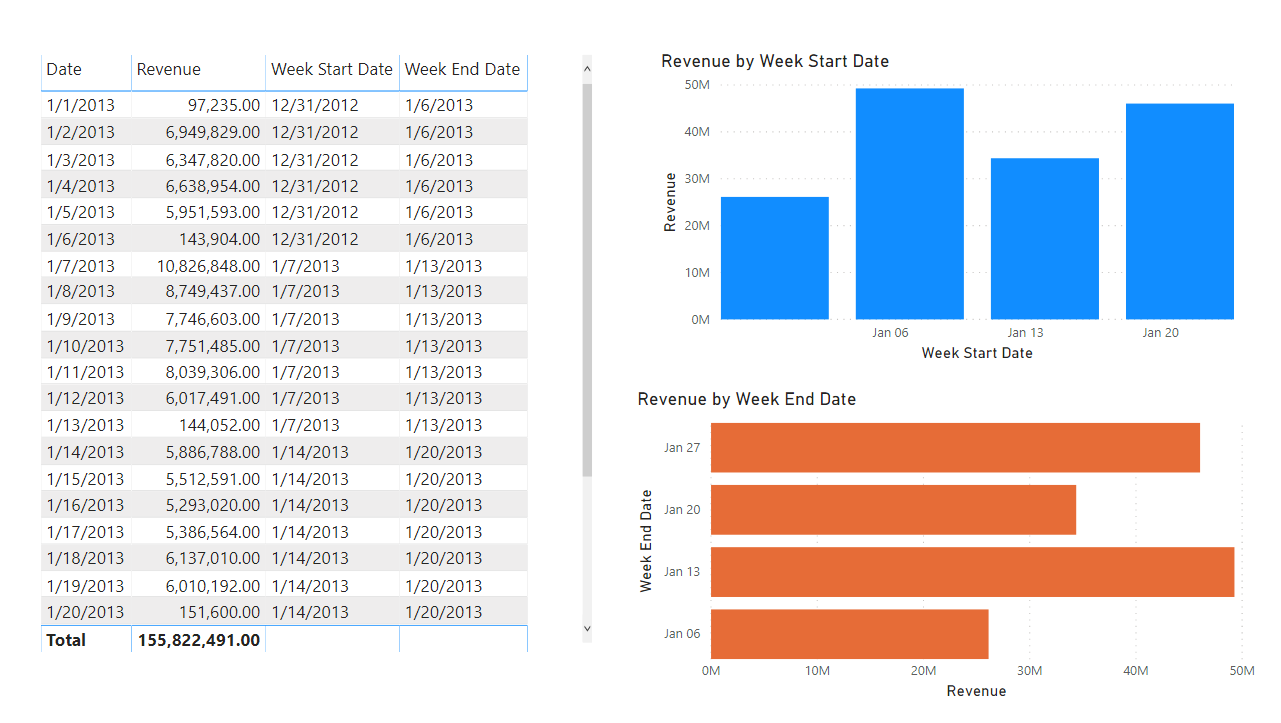
And there you have it! Our revenue is grouped on the weekly level instead of on the daily level. This is extremely easy to do with just a bit of DAX! I hope you enjoyed this trick. Make sure to subscribe to the BI Elite blog and check out the BI Elite YouTube channel!
Hi there
Thank you for all the videos. I’m am trying to calculate week numbers based on start and end of the week. I am following your instructions but my formula has an error. It does not recognize “Data” in my dax.formula. please note I’m using direct query for a SQL database
Thanks
This is fantastic! I’ve been looking for a way to do this for a few days. This made my life so much easier! Thanks. 🙂
Thank you!! Exactly what I needed. WeekNUM was close but your solution is best: Week Start Date = Data[Date] – WEEKDAY(Data[Date],2) + 1
Thanks, it was helpful at work! 🙂